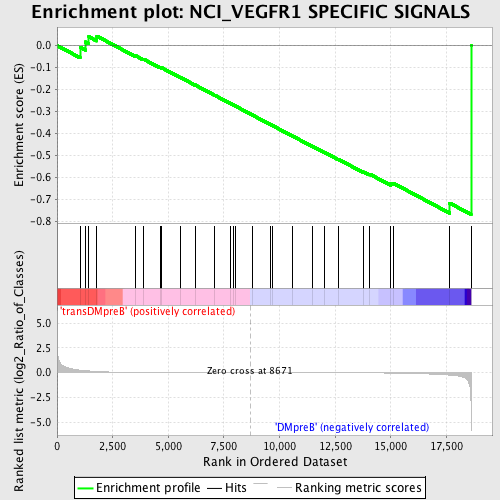
Profile of the Running ES Score & Positions of GeneSet Members on the Rank Ordered List
| Dataset | Set_04_transDMpreB_versus_DMpreB.phenotype_transDMpreB_versus_DMpreB.cls #transDMpreB_versus_DMpreB.phenotype_transDMpreB_versus_DMpreB.cls #transDMpreB_versus_DMpreB_repos |
| Phenotype | phenotype_transDMpreB_versus_DMpreB.cls#transDMpreB_versus_DMpreB_repos |
| Upregulated in class | DMpreB |
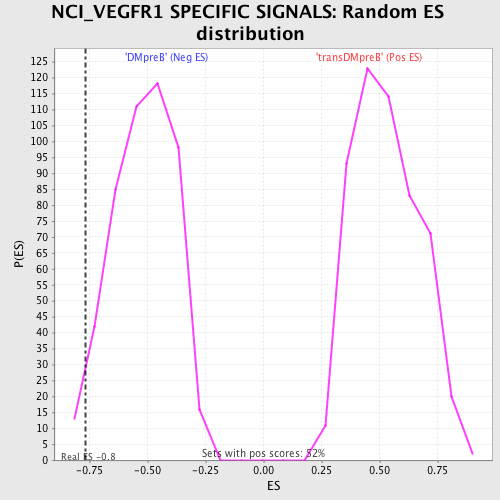
| GeneSet | NCI_VEGFR1 SPECIFIC SIGNALS |
| Enrichment Score (ES) | -0.7674995 |
| Normalized Enrichment Score (NES) | -1.4855534 |
| Nominal p-value | 0.028985508 |
| FDR q-value | 0.54188293 |
| FWER p-Value | 1.0 |
| PROBE | DESCRIPTION (from dataset) | GENE SYMBOL | GENE_TITLE | RANK IN GENE LIST | RANK METRIC SCORE | RUNNING ES | CORE ENRICHMENT | |
|---|---|---|---|---|---|---|---|---|
| 1 | VEGFA | 22969 | 1034 | 0.253 | -0.0081 | No | ||
| 2 | MAPK3 | 6458 11170 | 1268 | 0.198 | 0.0164 | No | ||
| 3 | RASA1 | 10174 | 1426 | 0.170 | 0.0399 | No | ||
| 4 | PDPK1 | 23097 | 1785 | 0.119 | 0.0428 | No | ||
| 5 | CBL | 19154 | 3514 | 0.025 | -0.0455 | No | ||
| 6 | CALM2 | 8681 | 3889 | 0.019 | -0.0620 | No | ||
| 7 | CD2AP | 22975 | 4626 | 0.013 | -0.0993 | No | ||
| 8 | CAV1 | 8698 | 4710 | 0.012 | -0.1015 | No | ||
| 9 | PLCG1 | 14753 | 5548 | 0.008 | -0.1450 | No | ||
| 10 | NCK1 | 9447 5152 | 6199 | 0.006 | -0.1789 | No | ||
| 11 | PGF | 21020 | 7089 | 0.003 | -0.2261 | No | ||
| 12 | PIK3R1 | 3170 | 7781 | 0.002 | -0.2630 | No | ||
| 13 | NOS3 | 16906 885 | 7919 | 0.001 | -0.2700 | No | ||
| 14 | HIF1A | 4850 | 8017 | 0.001 | -0.2750 | No | ||
| 15 | NRP2 | 5194 9486 5195 | 8763 | -0.000 | -0.3151 | No | ||
| 16 | CALM1 | 21184 | 9605 | -0.002 | -0.3599 | No | ||
| 17 | AKT1 | 8568 | 9661 | -0.002 | -0.3625 | No | ||
| 18 | CALM3 | 8682 | 10582 | -0.004 | -0.4111 | No | ||
| 19 | PIK3CA | 9562 | 11488 | -0.007 | -0.4585 | No | ||
| 20 | PTPN11 | 5326 16391 9660 | 12011 | -0.009 | -0.4850 | No | ||
| 21 | FLT1 | 3483 16287 | 12654 | -0.012 | -0.5173 | No | ||
| 22 | PRKACA | 18549 3844 | 13785 | -0.020 | -0.5743 | No | ||
| 23 | PRKCA | 20174 | 14043 | -0.023 | -0.5839 | No | ||
| 24 | GAB1 | 18828 | 14997 | -0.041 | -0.6275 | No | ||
| 25 | VEGFB | 23800 | 15103 | -0.044 | -0.6249 | No | ||
| 26 | MAPK1 | 1642 11167 | 17642 | -0.244 | -0.7156 | Yes | ||
| 27 | HSP90AA1 | 4883 4882 9131 | 18608 | -4.096 | 0.0004 | Yes |